Quantitative Analysis
(Human) members of group
The following section examines the inter-annotator agreement within the five-person research group itself. The five members (hereafter referred to as N, M, C, T, and A) operated on a rotating-pair basis, with each pair annotating fifty posts. Of the 500 posts in the dataset, 20 were excluded due to missing labels from one or both annotators, leaving 480 paired observations distributed across the 10 unique annotator pairings (46-50 posts per pair)

For this assessment, we report two complementary statistics for each pair: Raw exact match agreement (the percentage of the labels that annotators agreed on) and Cohen’s κ. Raw exact match, although easy to understand, can be misleading because it’s affected by how frequently each annotator uses certain categories. If both annotators favor a particular label, they are more likely to agree on it simply by chance. Cohen’s κ adjusts for this by estimating how much agreement would be expected if the annotators were labelling independently, then comparing the observed agreement to the baseline and expressing it relative to the highest possible agreement beyond chance. A κ of 0 indicates agreement no better than chance; a κ of 1 indicates perfect agreement. Following the convention introduced by Landis and Koch (1977), κ values are interpreted as slight (≤0.20), fair (0.21–0.40), moderate (0.41–0.60), substantial (0.61–0.80), and almost perfect (0.81–1.00) (Landis and Koch, 1977)


Across the ten pairs, raw agreement ranged from 62.5% to 83.7% (mean = 72.6%) and Cohen’s K ranged from 0.344 to 0.704 (mean = 0.513). The pooled κ across all 480 paired observations was 0.518. This places the group’s overall annotator agreement in the moderate range (0.41–0.60). Eight of the ten pairs show moderate agreement in their labelling, with one pair showing substantial agreement (N & M, κ = 0.704) and one showing fair agreement (C & T, κ = 0.344)
The 5 x 5 pairwise agreement matrix reveals some important information about different annotator pairs. No annotator was a strict outlier: all pairwise agreements remained above 60% raw and 0.34 in κ, indicating that no single member was systematically misaligned with the rest. M has the most consistent agreement degree across partners, ranging from 72.9% to 83.7%, and a consistent Cohen’s κ that is greater than 0.5. N-M pairing exhibited the most compatibility (83.7%, K = 0.704). C exhibited the lowest mean agreement within the annotators, ranging from 62.5% to 72.9%, and κ values clustered in the lower half of the moderate and fair band (0.344–0.514). C-T pairing exhibited the least compatibility with K values of 0.344.

An analysis of the aggregate per class agreement between the annotators revealed more insights. Pooled across all ten pairs (n = 960 paired observations), annotators agreed on 75.1% of posts labelled Normal and 74.3% of posts labelled Offensive, but only 50.6% of posts labelled Hate Speech. The Normal-Offensive distinction was clearer within the group whereas there appears to be disagreement within the Offensive-Hate speech labelling.
Original dataset annotators (AMT) and group members
Considering that the database used in this study contained the annotations from those contracted by Amazon Mechanical Turk, we can use this data to compare the annotations between the results displayed by our study’s annotations and those from Amazon Mechanical Turk, used in training BERT for hate speech detection.

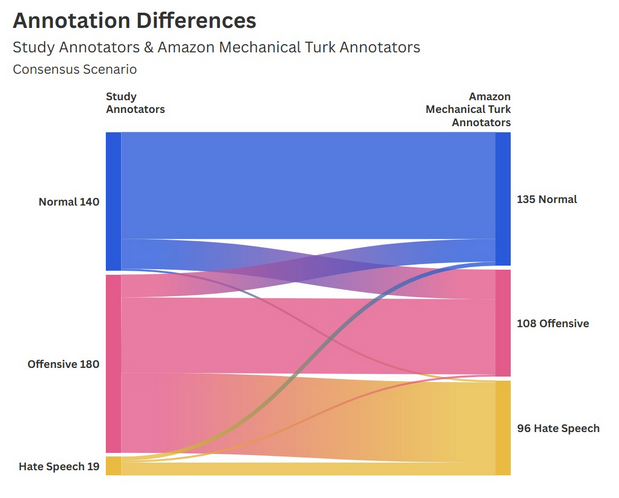
To ensure an accurate qualitative measurement, this analysis contained only those posts where the group annotations (H1 and H2) were in agreement, and those where the three Amazon Mechanical Turk annotations were in agreement. These two preconditions leaves the analysis with 167 posts. From the totals alone, we can determine that the Amazon Mechanical Turk annotations were far more likely to classify comments as ‘Hate Speech’ than the study group annotations (26,9% versus 4,8%).

Using conditional formatting, we can see that the two groups of human annotators are clearly aligned in their perception of ‘normal’ posts, with 75 cases of overlap, representing 44,9% of this subset of the dataset. However, the data shows that the perceptions of ‘Offensive’ and ‘Hate Speech’ posts diverge between the two groups. Strikingly, 39 posts classified as ‘Hate Speech’ by the Amazon Mechanical Turk group were classified as “Offensive” by the study group. Despite a comparatively clearer agreement on the ‘Offensive’ classification, the two groups only agreed on the ‘Hate Speech’ 5 times. However, the low sample of this subset (167/500 original posts or 33.4%) might influence these results. To counter this, we undertake a second analysis to compare the two human groups. Given that the Amazon Mechanical Turk group is composed of three individuals, increasing the likelihood of differences within the group, we take the majority classification into account instead of full consensus. For example, if a post was classified by the group as ‘Hate Speech’ by two individuals and ‘Offensive’ by one, we take this post into account under the ’Hate Speech’ classification.

Now, considering those posts where there was a majority agreement (>50%) within the Amazon Mechanical Turk group, we are able to see that there is no major shift between the previous analysis, leading to conclude that the smaller sample did not affect the quantitative analysis. With 339 posts taken into account out of 500 (67,8%) from the original database, we still see the stark contrast between the likelihood of the study group and the Amazon Mechanical Turk to classify posts as ‘Hate Speech’ (28,3% versus 5,6%).

Using conditional formatting, we can see that the significant differences in the classifications for ‘Hate Speech’ remain. Indeed, the two groups only agreed on the ‘Hate Speech’ classification for 13 posts. In fact, the second most common overlap for the two groups after ‘Normal-Normal’ is ‘Offensive-Hate Speech’ where the study annotators classified the post as ‘Offensive’.
Grok and Claude
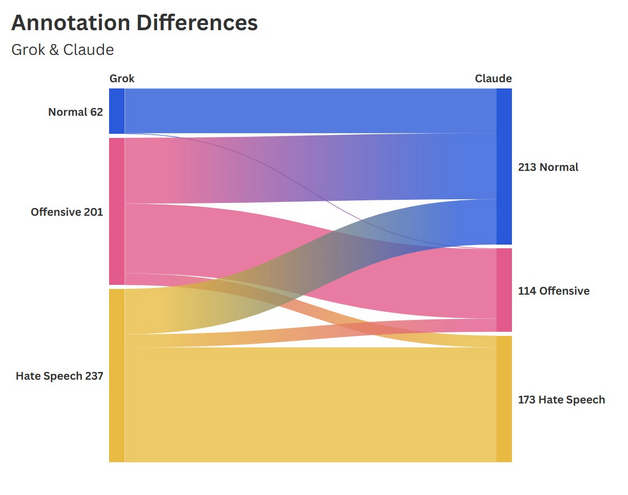
When comparing Grok’s and Claude’s annotations, the first and most evident difference is the distribution of classifications across the three categories. Grok has a high sensitivity in classifying Hate Speech, annotating nearly half of the cases as such (n = 237; see Table). It subsequently annotated 201 posts as Offensive and only 62 posts as Normal. By contrast, Claude’s distribution is considerably more balanced, detecting 173 cases of Hate Speech, 114 Offensive posts and 213 as Normal. The substantial difference between the distributions suggests a lower threshold for harm attribution in Grok.

Overall, the two models overlap in 313 cases, meaning that in 62.6% of cases, they agree on the classification. The difference in distribution likely stems from divergent definitions of hate, offensive speech, or normal speech, given that the prompt did not provide any further information about which definition to use.
The highest alignment between the two models is found in the Normal category, where, when Grok annotates a post as normal, Claude concurs in 98.4% of cases. This finding indicates a shared and relatively stable conception of harmless content. Contrarily, when Grok classifies a post as Offensive, the two LLMs are least aligned, with only 47.3% overlap. The divergence is in 90 cases, a de-escalation by Claude into the Normal category, and in 16 cases, Claude escalated the classification towards Hate Speech, further demonstrating their different thresholds.
The most significant finding concerns the asymmetry in Hate Speech classification. Among the sample of 500 posts, there was not a single case where Claude detected Hate Speech and Grok labelled it as normal. Whereas the reverse occurred in 62 cases (26%). This divergence points to a structural difference in how each model interprets the boundary between harmful and acceptable content, with Grok displaying a lower threshold for attributing harm and, consequently, a higher likelihood of false positives.
Between human group and LLMs
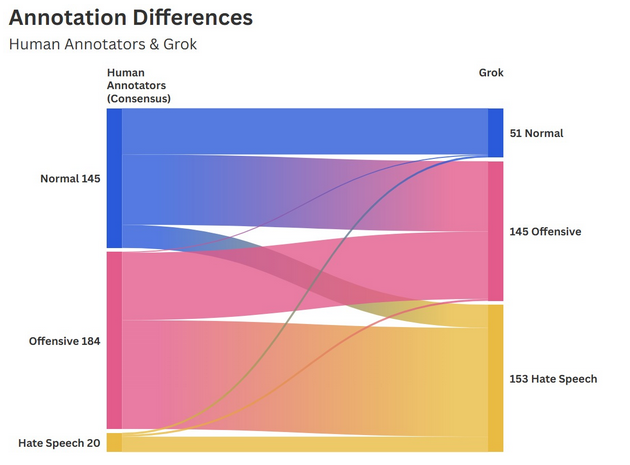
The two human annotators (H1 + H2) from the research group have reached a consensus in 349 cases or 69,8% of the time. Comparing these consensual classifications with the two selected LLMs reveals substantial divergences, especially with Grok. In 38,4% of the cases, the human consensus and Grok’s classification overlap. Comparing the consensus with the other LLM Claude, the overlap reaches 53,9% with 188 cases. The cross-tabulation between Grok and the Group Consensus reveals the lowest alignment between all groups in this study. This becomes evident when considering that the Grok classified the majority of cases as Hate Speech, whereas the Group Consensus identified only 20 cases of Hate Speech. An agreement on the Hate Speech classification was reached in only 10,5% of cases. The alignment was Normal 94% of the time. The finding suggests that human judgment applies a considerably narrower definition of Hate Speech whilst making proportionally greater use of the Offensive and Normal categories. This notion is reinforced by the fact that, in 119 cases (73%), the research group interpreted most of the cases that Grok classified as Hate Speech as Offensive.

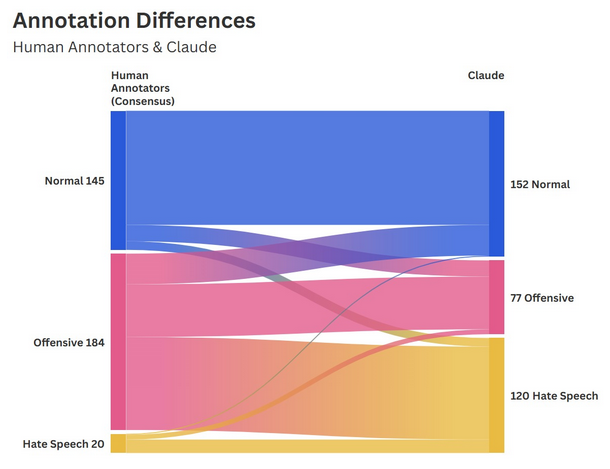
When comparing Claude with the human consensus group, a pattern similar to Grok’s can be observed. The biggest difference between the two annotators is found in the Hate Speech category, where there is only 11,7% overlap, with 80,9% of cases de-escalated to Offensive by the human group. Among the other two categories, there is much more alignment with the Normal classification, reaching 78,3% consensus, and the Offensive one at 71,4%.

Citations
Landis, J.R. and Koch, G.G. (1977) ‘The Measurement of Observer Agreement for Categorical Data’, Biometrics, 33(1), pp. 159–174. Available at: https://doi.org/10.2307/2529310.